Order Flow
What Is a Footprint Chart? A Beginner's Guide to Order Flow Trading
Some links on this page are affiliate links. We may earn a commission if you sign up through them, at no extra cost to you.
If you've ever watched a professional futures trader stream their charts, you've probably had the same reaction most traders do: "What on earth am I looking at?"
Instead of candles, indicators and trendlines, the screen is filled with numbers. Thousands of them. Green numbers, red numbers, volume clusters, imbalances, delta values. At first glance it looks more like a spreadsheet than a trading chart.
Welcome to the world of footprint charts. For many futures traders they've become one of the most powerful tools for understanding what is happening inside the market in real time. For others, they're an unnecessarily complicated way of saying what price action was already showing. As with most things in trading, the truth probably lies somewhere in the middle.
Footprint Charts Explained in One Sentence
A footprint chart is an order flow chart that shows the actual buying and selling activity that occurred at every individual price level inside a candle — not just where price moved, but how traders interacted with the market while it moved.
What Is a Footprint Chart?
A traditional candlestick shows only four pieces of information: open, high, low and close. A footprint chart goes much deeper. It shows:
- how many contracts traded at each price level
- whether buyers or sellers were more aggressive
- where large market participants entered
- where absorption occurred
- where buying or selling imbalances developed
- where liquidity was consumed
- where momentum entered or disappeared
In simple terms: a candlestick chart shows you where price went. A footprint chart attempts to show you how price got there. That's why many futures traders become obsessed with them.
How Does a Footprint Chart Work?
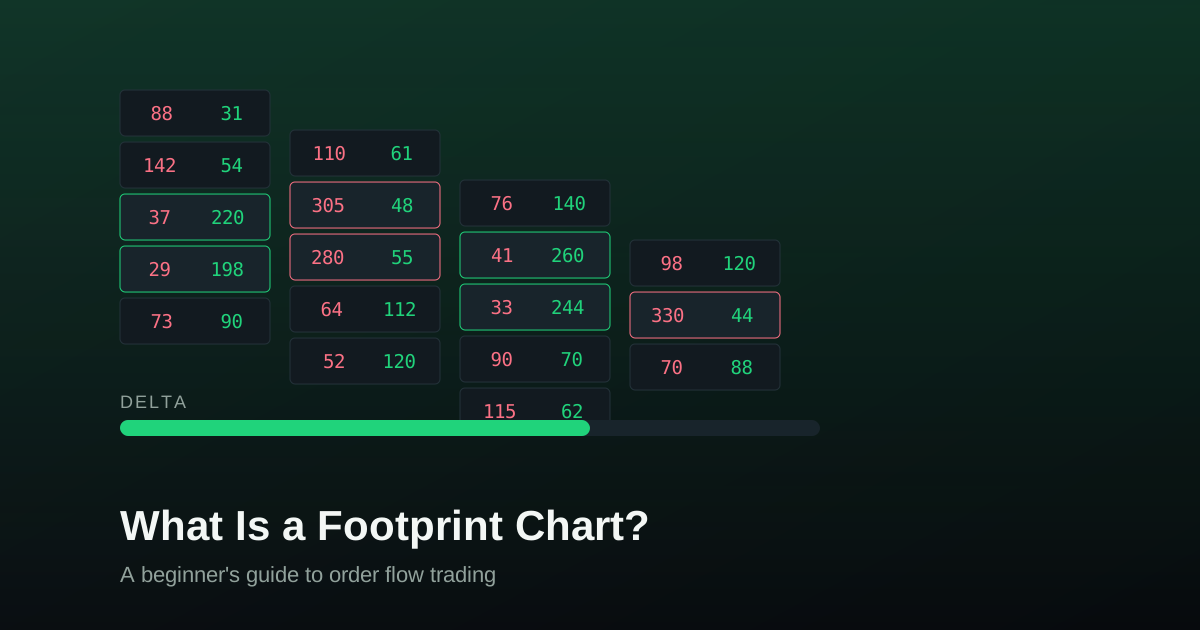
Every trade in the futures market has two participants: a buyer and a seller. Footprint charts visualize exactly how those transactions occur. Inside each price level of a candle you'll often see two numbers, for example 120 × 45.
Typically the number on the left represents contracts sold aggressively at market into resting bid orders, and the number on the right represents contracts bought aggressively at market into resting ask orders.
This distinction is important because footprint traders are not simply measuring volume — they're measuring aggression. A normal candlestick simply cannot show this.
A Simple Example
Imagine gold futures trade from 3400 to 3410 during a five-minute candle. A standard candlestick would show open 3400, high 3410, low 3398, close 3408. Useful, but limited.
A footprint chart might reveal heavy buyers entering at 3401, large sellers absorbing buying pressure at 3408, aggressive market buying failing to push price higher, and sellers taking control near the highs. Suddenly the same candle tells a much richer story.
What Is Delta?
One of the first concepts footprint traders learn is delta — the difference between aggressive buyers and aggressive sellers. A positive delta means more contracts were bought aggressively at market; a negative delta means more were sold aggressively.
Here's where many beginners trip up: positive delta does not automatically mean price will go higher, and negative delta does not automatically mean price will go lower. Sometimes the opposite happens — which is where absorption comes in.
What Is Absorption?
Imagine buyers aggressively hit the market with huge buy orders. Normally you'd expect price to explode higher. Instead, price barely moves. Why? Because large passive sellers are absorbing all of that buying pressure.
To many order flow traders this can signal that strong sellers are defending a level. The reverse can happen at lows, where large buyers absorb aggressive selling and prevent price from falling further. These are the kinds of details footprint traders spend years learning to read.
What Are Imbalances?
An imbalance occurs when buying or selling volume becomes significantly stronger on one side of the market — for example, buyers trading three times more volume than sellers at a price level. Many footprint platforms highlight these areas automatically, and traders use them to identify momentum and potential continuation moves.
Stacked imbalances
A stacked imbalance occurs when multiple buying or selling imbalances appear on consecutive price levels. Many order flow traders interpret this as evidence of aggressive participation from larger players: stacked buying imbalances often suggest momentum continuation, stacked selling imbalances often suggest the opposite.
Unfinished auctions
Markets frequently finish auctions with little or no opposing volume at extremes. When significant volume remains active at the highs or lows, some traders interpret this as unfinished business that may attract future price movement. Like most order flow concepts, interpretation varies between traders.
Why Futures Traders Love Footprint Charts
Footprint charts are popular in futures trading for one simple reason: the futures market is centralized. Every contract traded on the exchange contributes to the same volume data, so everyone sees the same information.
That lets footprint charts display real traded volume, real market orders, real buying and selling pressure, and real bid/ask activity. For order flow traders, that level of transparency is incredibly valuable.
Why CFD Traders Usually Don't Use Footprint Charts
CFD markets are decentralized — there is no single exchange where every trade occurs, so true exchange volume data doesn't exist in the same way. That's why footprint trading is almost entirely associated with futures rather than CFDs.
If you trade NQ, ES, CL or GC futures, footprint charts are widely available. If you trade NAS100, XAUUSD or EURUSD CFDs, footprint trading becomes significantly more complicated. (For the full breakdown, see CFD vs futures trading.)
What Is the DOM?
The DOM, short for Depth of Market, is another popular order flow tool used alongside footprint charts. It shows resting limit orders, market orders hitting those levels, liquidity appearing or disappearing in real time, and changes in market depth.
Many futures scalpers trade almost entirely from the DOM without even looking at candlestick charts. Platforms such as Jigsaw Daytradr were built specifically around this style of trading.
Which Platforms Support Footprint Charts?
Several professional trading platforms support footprint charts. The most popular include:
- ATAS
- Sierra Chart
- Bookmap
- NinjaTrader
- Quantower
- VolFix
- MotiveWave
- Jigsaw Daytradr
Footprint Charts vs Candlestick Charts
| Candlestick charts | Footprint charts |
|---|---|
| Show price movement | Show activity inside the movement |
| Focus on OHLC data | Focus on executed volume |
| Easier to learn | Steeper learning curve |
| Common in CFDs | Common in futures |
| Great for price action | Great for order flow |
Neither chart type is objectively superior. They're simply different tools.
Are Footprint Charts Better Than Price Action?
Ask a dedicated order flow trader and they'll tell you footprint charts reveal information candlesticks never can. Ask a pure price action trader and they'll tell you everything footprint traders see is already reflected in price. Both sides have valid arguments, and trading history is full of profitable traders from both camps.
The Biggest Mistake Beginners Make
Many new traders discover footprint charts and assume they've found the secret that institutions use. Unfortunately, trading doesn't work like that.
A footprint chart is not an edge — it's a tool, just like moving averages, support and resistance, VWAP or market structure. The edge comes from how the trader uses the information, not from the chart itself.
Should You Learn Footprint Trading?
If you trade futures, the answer is probably yes. Even if footprint charts never become your primary tool, understanding delta, absorption, imbalances, stacked imbalances and aggressive order flow can dramatically improve your understanding of market behaviour.
If you're primarily a CFD trader using MT5 to trade gold or indices, footprint charts are probably less important. Many successful CFD traders never touch them.
Sponsored
Want to put order flow to work on futures?
Apex Trader Funding is one of the most popular futures prop firms for order flow traders. Read our Apex review, or visit their official site.
Visit Apex Trader FundingFinal Thoughts
A footprint chart is essentially a way of looking inside the candle. Instead of simply seeing where price moved, traders can see the buying and selling activity that helped create that movement.
For futures traders this context can help explain why markets behave the way they do. For others, traditional price action remains more than enough. Neither approach is inherently better — they're simply different ways of reading the same market.
Because at the end of the day, every chart on your screen is trying to answer the same question: who is in control right now — buyers or sellers? Footprint charts simply try to answer it with a little more detail.
Frequently asked questions
Are footprint charts only for futures trading?
Mostly, yes. Because footprint charts rely on centralized exchange volume, they are primarily used in futures markets.
Can you use footprint charts on forex?
Not true exchange footprints. Forex and CFDs are decentralized markets, meaning there is no single source of volume data.
Are footprint charts better than candlesticks?
No. They simply provide a different type of information.
Do professional traders use footprint charts?
Many futures traders do, and many successful traders don't. There is no universal requirement for profitability.
Are footprint charts useful for scalping?
Very. Footprint charts are particularly popular among futures scalpers trading products such as NQ, ES, CL and GC.
Keep reading
Risk note